2011-2024 Lake Water Data Results

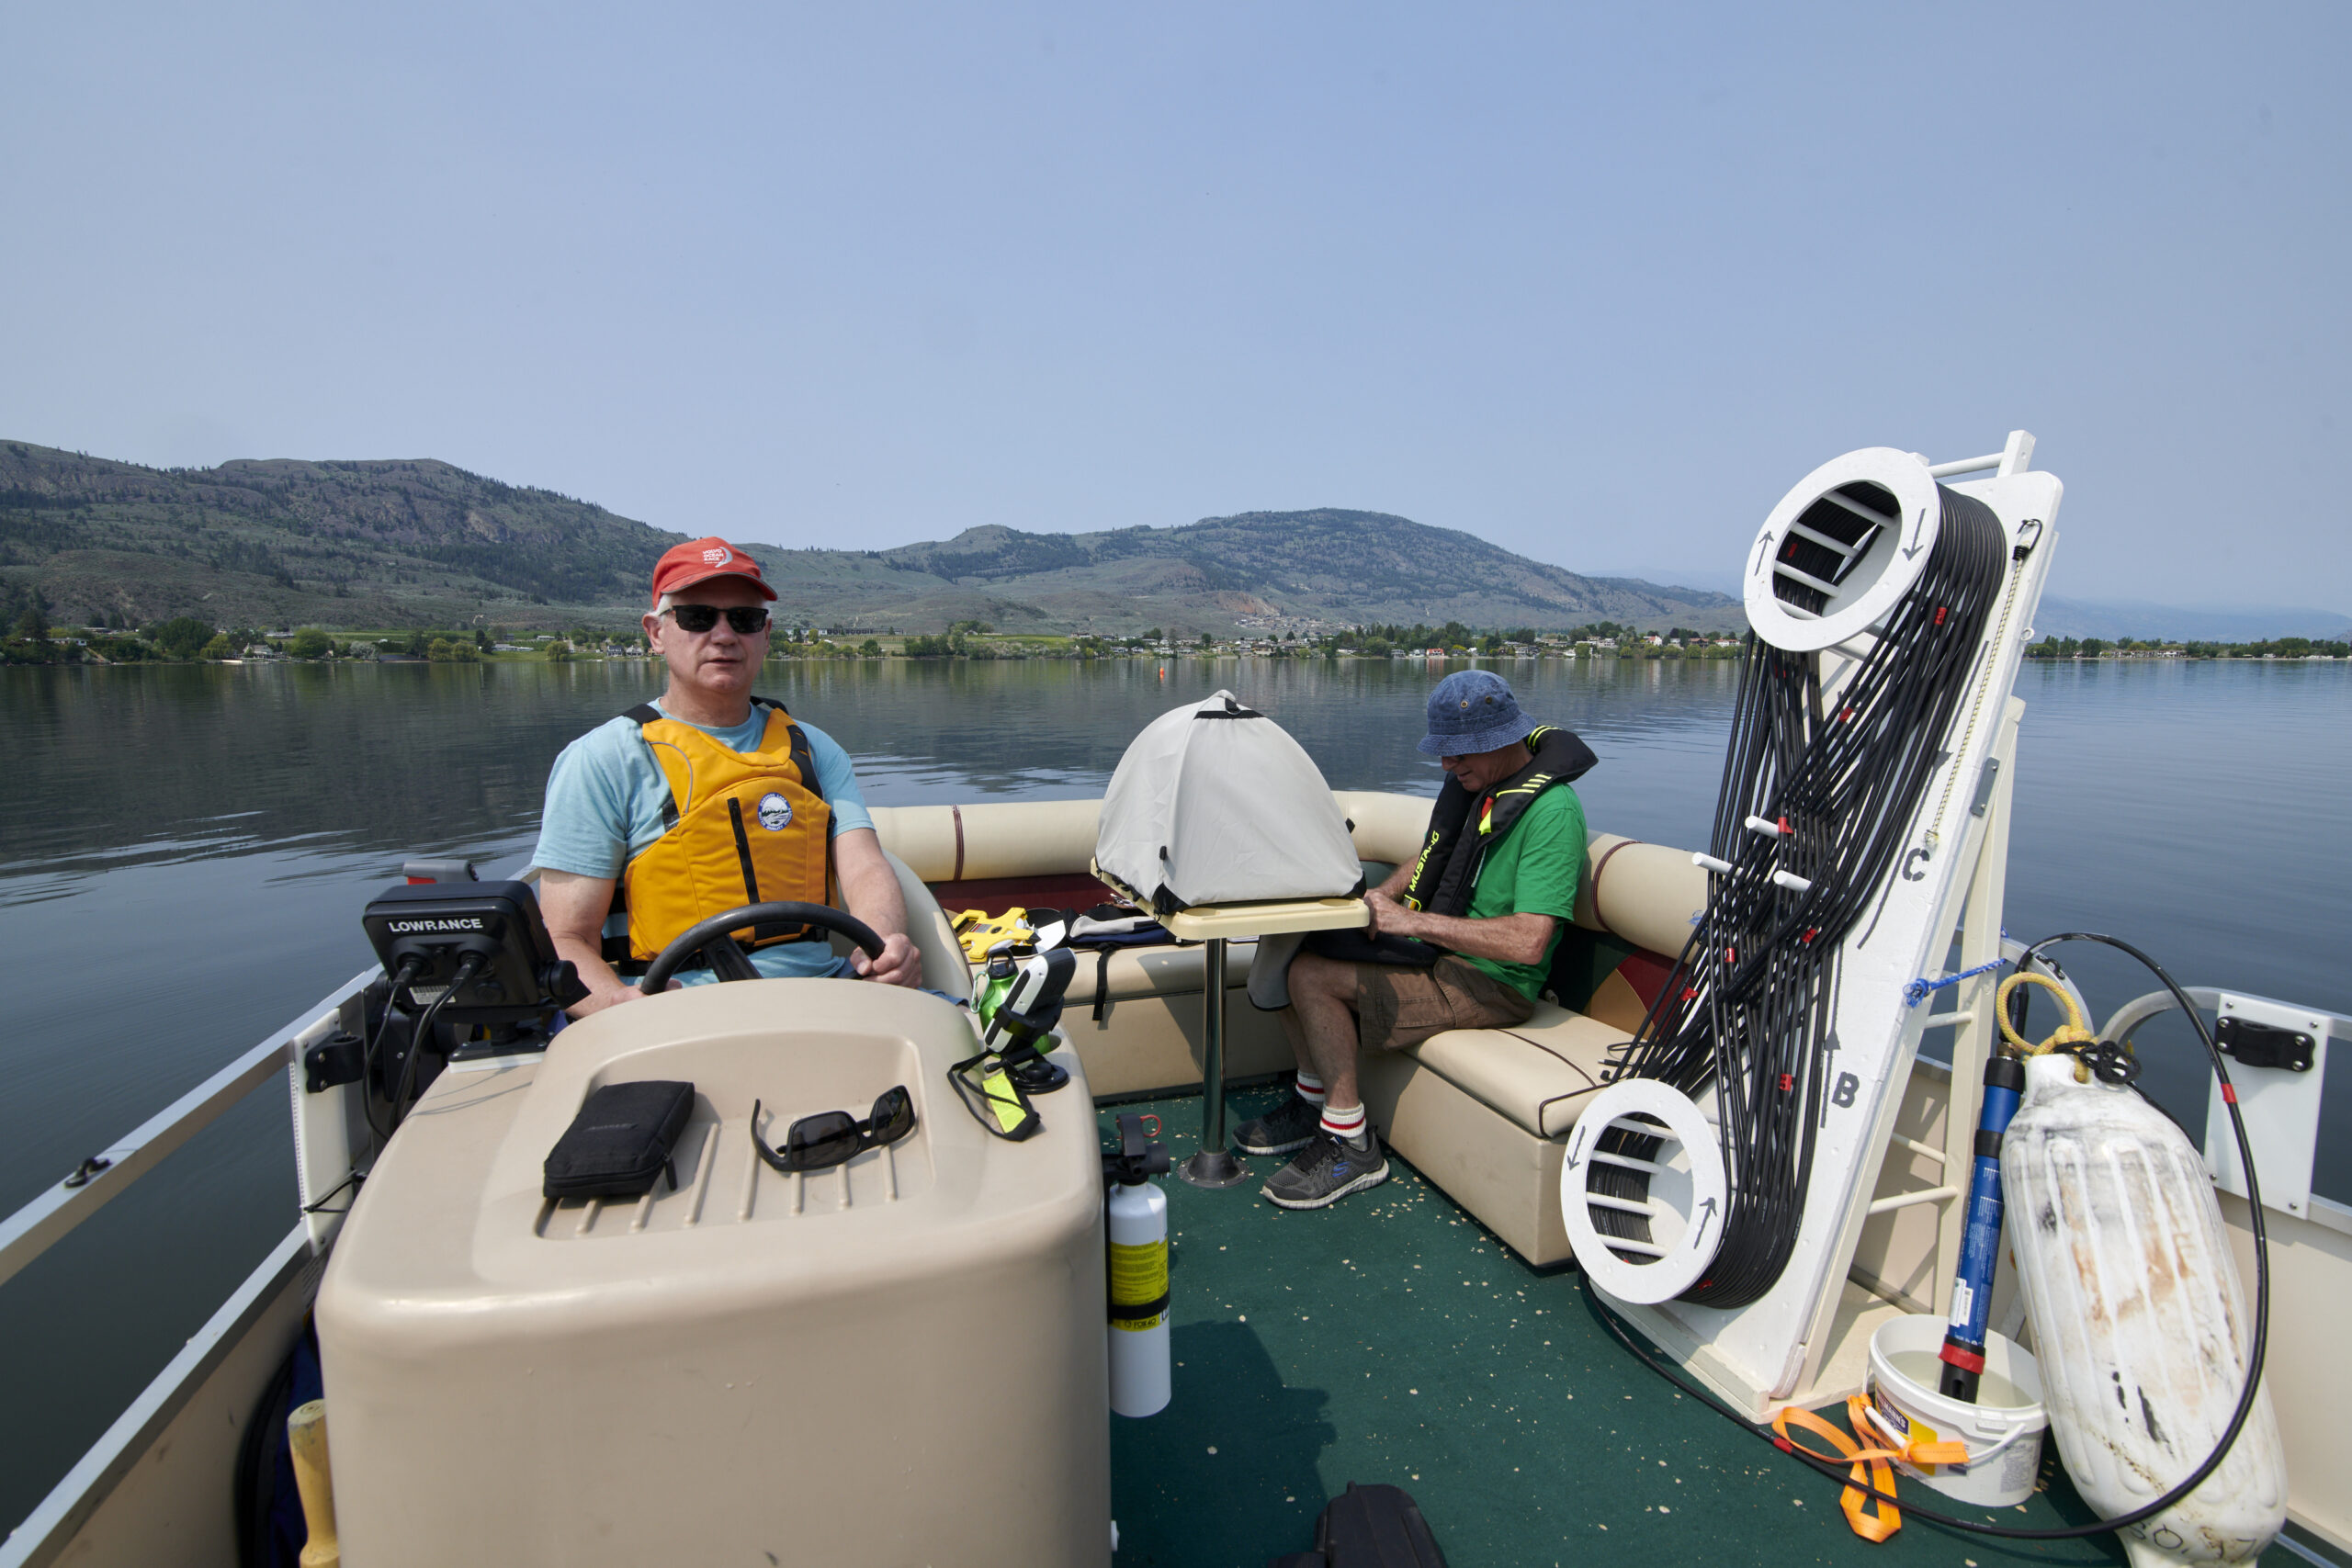
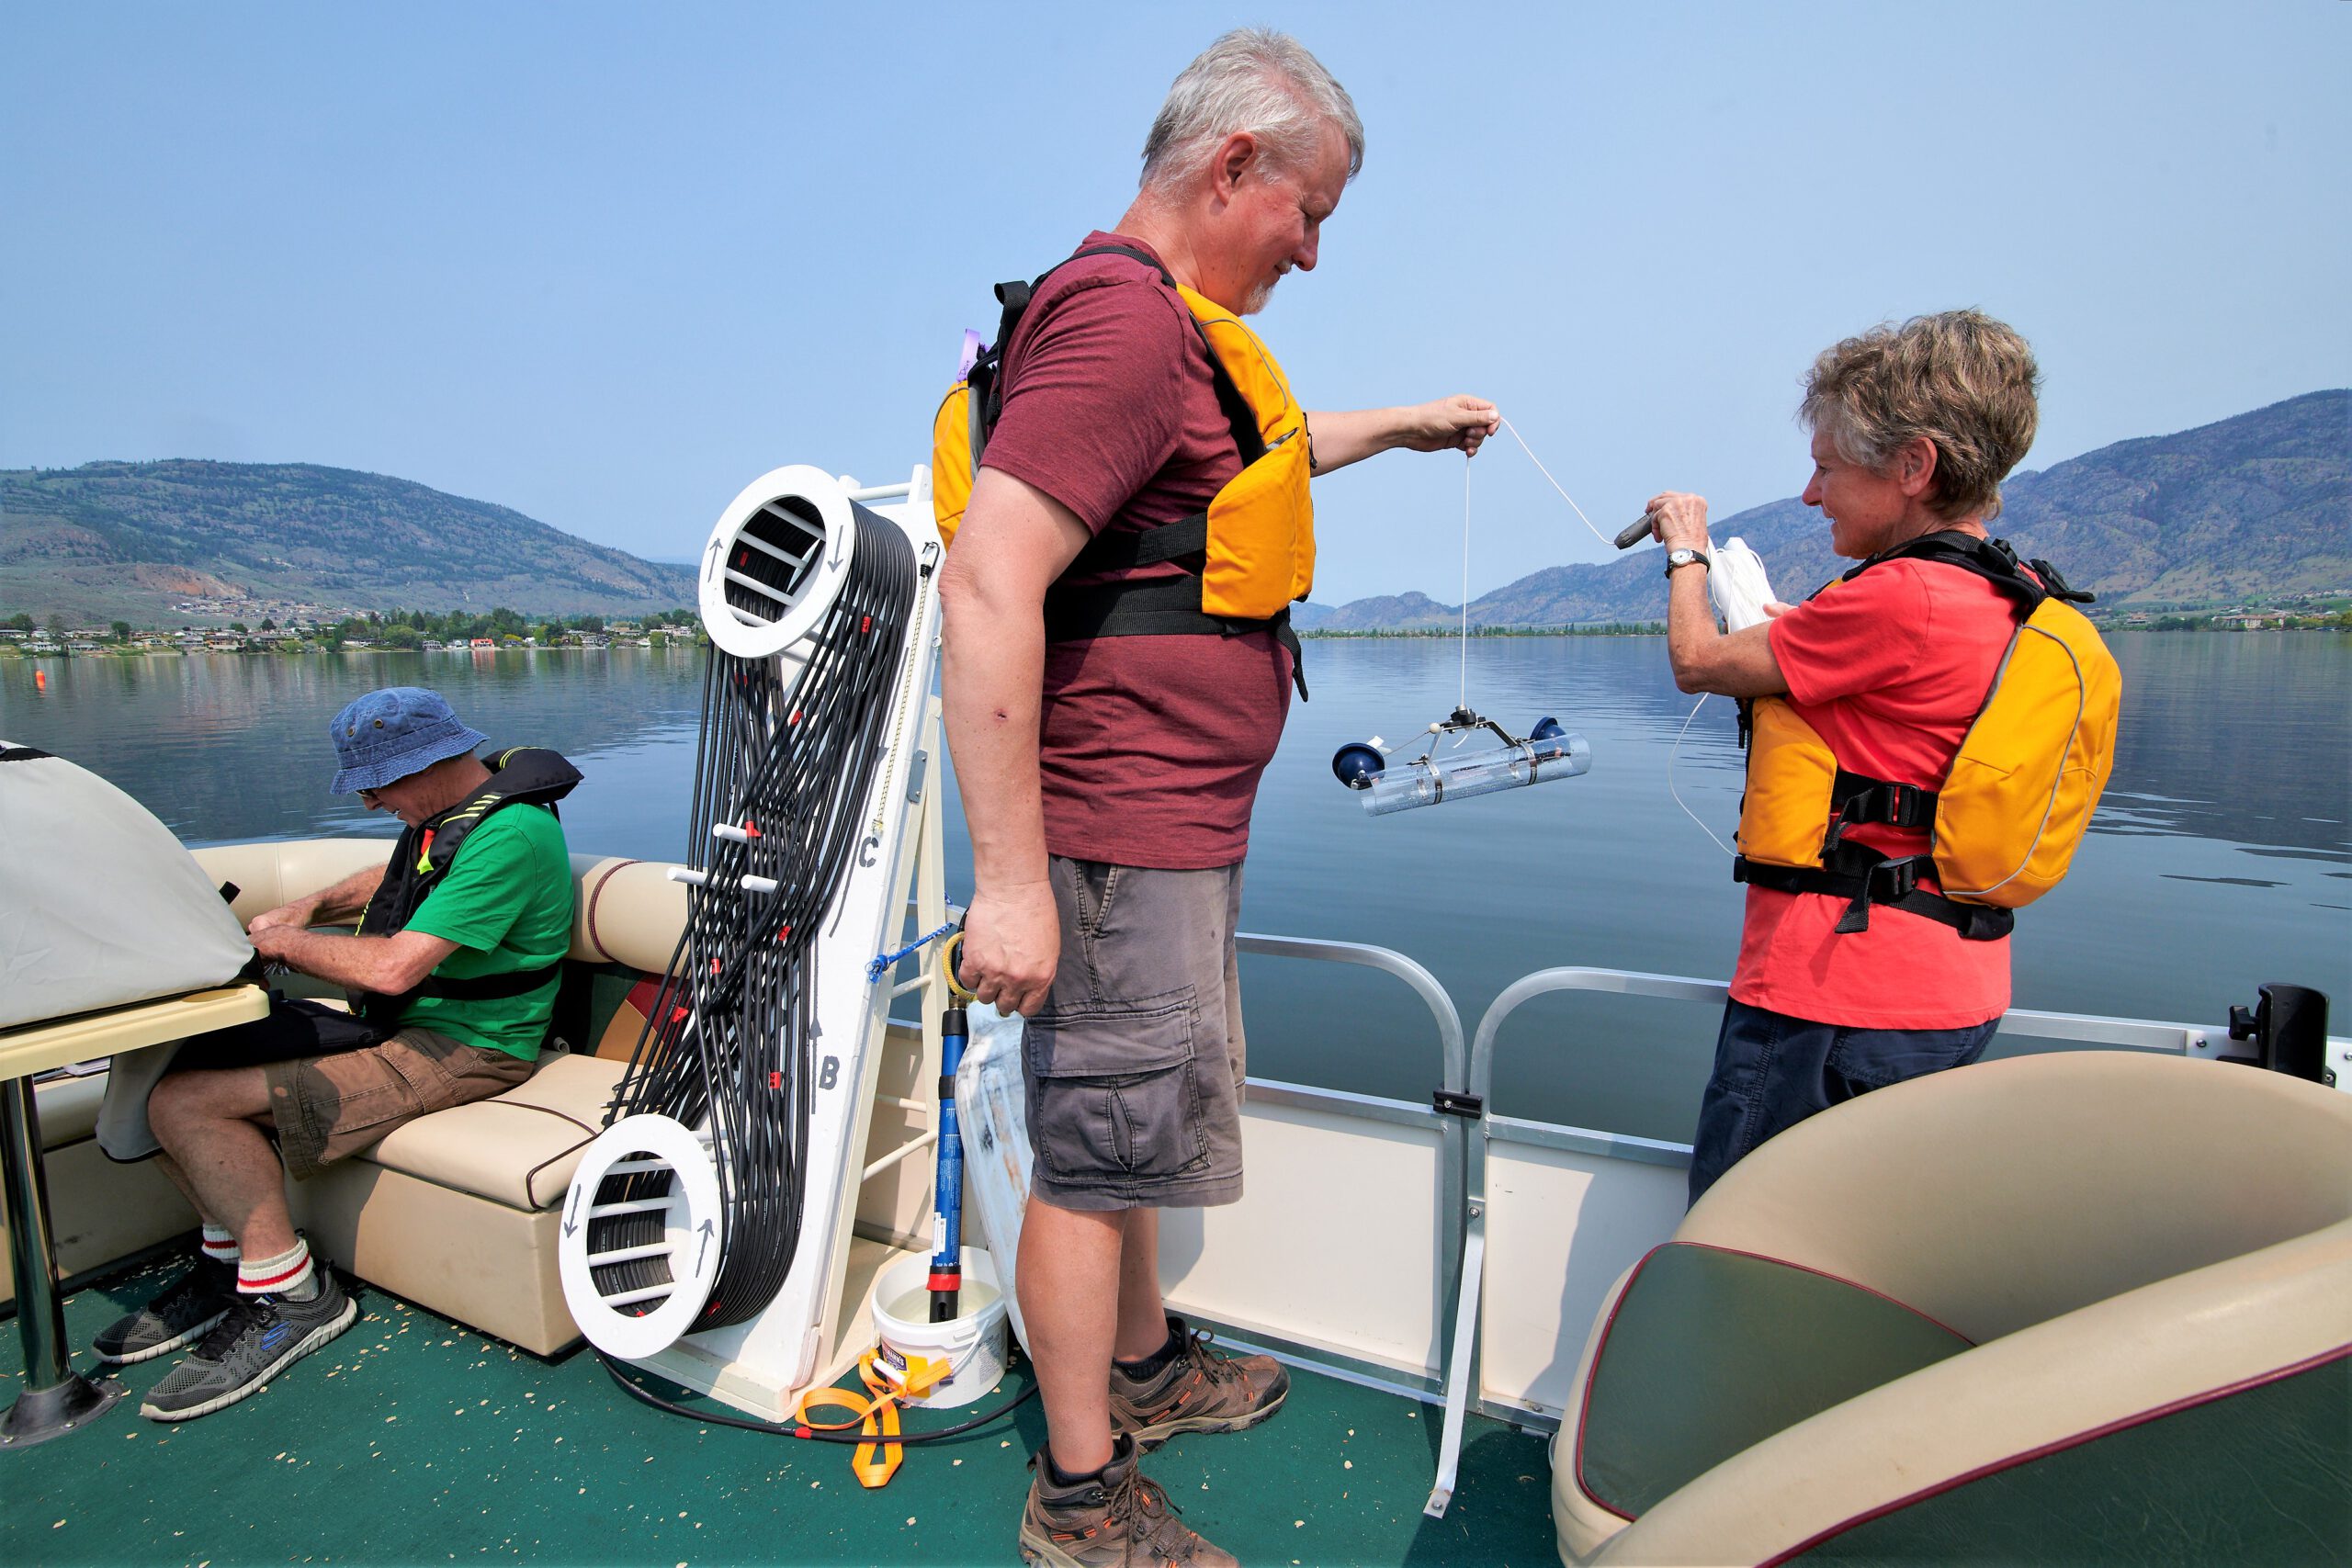
Many thanks to the hard working crews of the the Osoyoos Lake Water Quality Society who have completed their pontoon water sampling research for 2023.
Under the meticulous direction of Trevor Reeves, the OLWQS has assembled water data from four areas on the Canadian side of Osoyoos Lake.
These areas include, the South Basin, Central Basin, White Sands and Packing House locations on Osoyoos Lake.
2024 CENTRAL BASIN DISSOLVED OXYGEN CENTRAL BASIN WATER TEMPERATURE
2024 SOUTH BASIN DISSOLVED OXYGEN SOUTH BASIN WATER TEMPERATURE
2024 WHITE SANDS DISSOLVED OXYGEN WHITE SANDS WATER TEMPERATURE
2024 PACKING HOUSE DISSOLVED OXYGEN PACKING HOUSE WATER TEMPERATURE
2023 CENTRAL BASIN SOUTH BASIN WHITE SANDS PACKING HOUSE
2022 CENTRAL BASIN SOUTH BASIN WHITE SANDS PACKING HOUSE
2021 CENTRAL BASIN SOUTH BASIN WHITE SANDS PACKING HOUSE
2020 CENTRAL BASIN SOUTH BASIN WHITE SANDS PACKING HOUSE
2019 CENTRAL BASIN SOUTH BASIN WHITE SANDS PACKINGHOUSE
2018 CENTRAL BASIN SOUTH BASIN WHITE SANDS PACKINGHOUSE
2017 CENTRAL BASIN SOUTH BASIN NORTH END WHITE SANDS PACKINGHOUSE
2017 Osoyoos Lake Water Testing Results – A Presentation by John Gates
2016 CENTRAL BASIN NORTH END SOUTH BASIN WHITE SANDS PACKINGHOUSE
The History of Lake Osoyoos water testing

Each week between May and October, a crew of Society volunteers go out on the lake and test the water for temperature, depth, dissolved oxygen, pH, specific conductivity, and water clarity (secchi disc). Results are sent to the BC Ministry of Environment. The following are spreadsheets from five locations on Osoyoos Lake beginning in 2011.
Records of lake conditions were initially collected by the Ministry of Environment from 1972-1993. Following that, the Osoyoos Lake Water Quality Society took over the task when government funding ran out.
The result is a detailed analysis of water conditions in Osoyoos Lake over the last 30 years which is proving crucial for both recreational and conservation purposes.
During the summer months the society uses the pontoon boat (purchased through public donations and grants), to collect weekly information on water clarity, oxygen content, temperature, pH, and the conductivity of water (‘specific conductance’).
We work closely with the BC Ministry of Environment and Environment Canada, monitoring jointly where possible and freely exchanging information and ideas.
All results of our monitoring are available to the public. Most of the instruments we use are of the high-tech digital kind, with one notable exception: the Secchi disk which is used to test the clarity of the water.
Pronounced ‘sekky’ and named after its Italian inventor, Fr. Pietro Secchi who was scientific advisor to the Pope in 1865, it is a remarkably simple 8-inch disk painted in black and white and lowered into the water on the end of a rope. When the black and white pattern is no longer visible to the naked eye, the depth of the rope is recorded as the Secchi reading. Our average readings are between 3 to 4 metres.
While in the boat we also watch for any changes in the water such as excessive milfoil, algae blooms, and dead fish.
We check the condition of the stormwater outflow pipes that enter into the lake since most water pollution comes via storm drains, and we are working with the town of Osoyoos towards eliminating some of these outflow pipes.
We also monitor and report changes to the lakeshore such as the removal of riparian trees, shrubs etc and construction of walls and buildings within the high water mark (both are illegal without special permits from the Ministry). Twice a year the Ministry of Environment joins up with us to do more extensive testing of the water, including the all-important nitrate and phosphate data. Nitrates are a chemical found in fertilizers and human and animal waste and are of great concern within the area’s groundwater: phosphates come from organic waste plus household and industrial detergents and soaps. The phosphate/nitrate situation has much improved in Osoyoos Lake, thanks partly to the upgrading of sewers and sewage treatment plants throughout the valley and partly to public education and awareness.
Beaches
The Health Department from Penticton over the years has been analysing water samples at our major beach areas, but ceased in spring 2001 due to lack of funds. Interior Health started the program up again in summer of 2006. They test for bacteria such as E. coli, and advisory signs are posted if levels exceed government standards. Beach water quality is typically poorer in summer when the warmer water escalates bacterial growth and swimmers and boat traffic stir up bacteria-containing sediments. Contamination is also more likely to increase during and after rainstorms. More on Interior Health’s beach water quality program
Water supply
Due to the increase in population and agricultural usage, there has been much public concern about the quantity of water available in the Okanagan valley for future use. In response to this, a major study was carried out by federal, provincial, municipal and volunteer experts working together to collect information on the entire watershed. Started in 2003, the ‘Groundwater Assessment in the Okanagan Basin’ project is so large it has been divided into many sub-projects. Organizations involved may include:
- Geological Survey of Canada
- Okanagan Basin Water Board
- Agri-Food Canada
- Freshwater Fisheries Society of BC
- Golders Associates – an environmental engineering company
- Ministry of Environment
- Interior Health Authority
- Canada Centre for Water Excellence (Jim Hendry)
- Simon Fraser University, Department of Earth Sciences
Lake Levels:
Monthly average lake levels for Osoyoos Lake from the real-time monitoring station at Oroville, WA Osoyoos Lake Levels – daily average – real-time data and graphs from monitoring station in Oroville, Wa. Real-time temperature, elevations, and water flow for Osoyoos Lake from the monitoring station at Oroville, WA
Other Data:
Real-time oxygen, temperature and turbidity (North Basin) from Environment Canada buoys (2) Real-time water flow and levels for Similkameen River BC Ministry of Environment observation wells data website for all of BC. (Scroll down to ‘Osoyoos’ for data 1969 – 2002. Click on ‘Ground Water Level Site’ at top of page for more recent data. ) BC Ministry of Environment observation wells – general information about the monitoring program. **State of water quality of Okanagan River at Oliver, 1980 – 1995- details of a 15-year monitoring program by Environment Canada taken near the bridge at Road #18. **Results of a 1979 – 2002 federal-provincial study done of water quality of the Okanagan River at Oliver. Daily, monthly & yearly water flow statistics for Okanagan River from 1961 to 2006 from monitoring station at Road#18, Oliver International Osoyoos Lake Board of Control, minutes of their last meeting (Sept 06) with summary of lake levels, water flow and drought statistics for previous years.
More Info:
Groundwater Assessment Study Report on water supply in the Okanagan by ‘The Tyee’ online newspaper, August 2006 Okanagan Water Supply & Demand Project

